- Λήψη συνδέσμου
- Ηλεκτρονικό ταχυδρομείο
- Άλλες εφαρμογές
free hosting

If you have Google Analytics installed on your website, you have a very powerful tool available to perform user research around your website traffic.
In this article, you’ll learn some tips and tricks to use Google Analytics to perform user research. The results from this research will help you better understand your audience so you can craft your site content around what your visitors are most likely to be interested in.

How To Navigate to Google Analytics User Research
Visit Google Analytics and log in using your Google account. Visit the web property you’ve registered in Google Analytics.
In the left navigation pane, expand the Audience section. This menu contains all of the User Research sections that we’ll cover in this guide. When you select Overview from this section, you’ll see a basic overview of your user traffic.
This view lets you add “segments” to compare audiences. We’ll get to adding segments in the last section of this article.
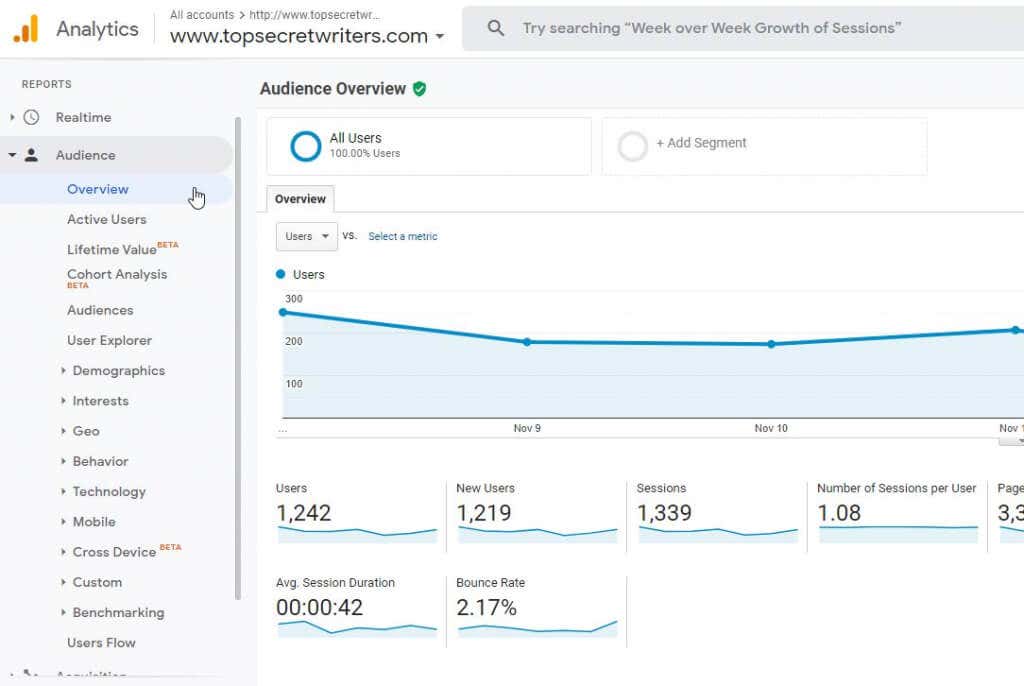
If you scroll down to the bottom of this page you’ll see a list of demographics on the left that you can select from. As you choose these, you’ll see a ranking on the right showing the demographic breakdown of your site visitors.
These demographics include language, country, city, browser, operating system, service provider, operating system, service provider, and screen resolution.
Exploring User Demographics
If you want to dig further into specific user demographics as part of your user research, scroll down the Audience menu, expand Demographics, and select Overview.
On this page you’ll see a basic visual overview of basic demographics — age and gender.

Under Demographics, you can select Age to see a breakdown of how many of your visitors are within certain age ranges.
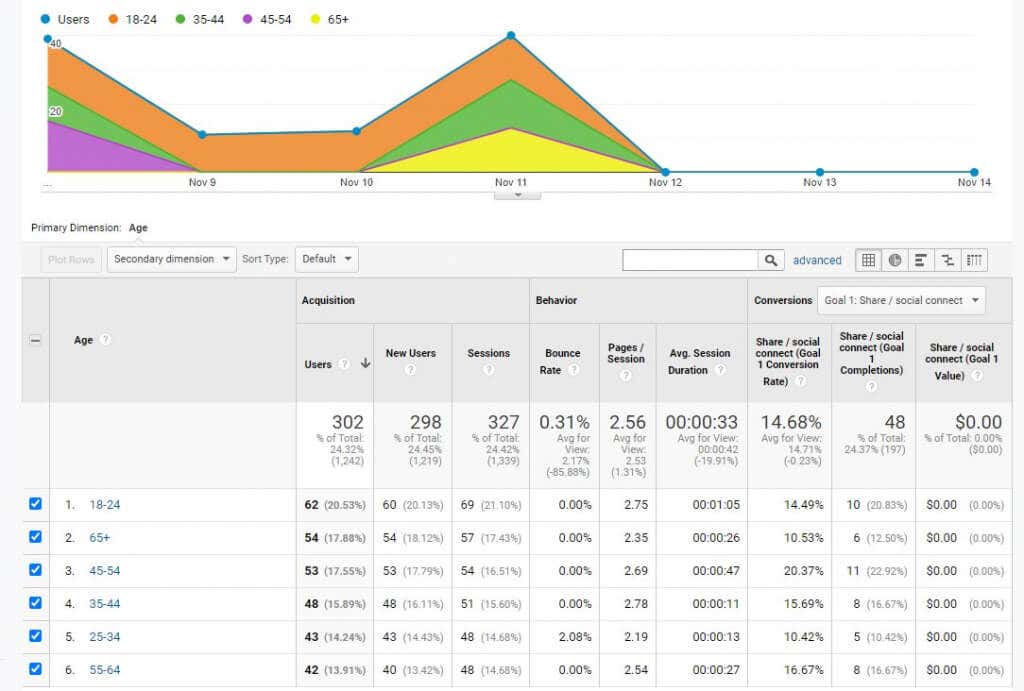
This can be very helpful to see if your website appeals more to younger, middle-aged, or older audiences. The graph will also show how these trends have shifted over time.
You can also see a similar breakdown of males or females visiting your site by selecting Gender under Demographics.

How to Use Basic Demographics: By understanding the ages and gender that make up the largest segment of your visitor base, you can better fine-tune your content to appeal to the widest audience. It will also help you identify large areas where you may need to grow your audience as well.
Beyond basic demographics, other sections under Audience in Google Analytics let you dig into many more details about your visitors.
Exploring Your Visitor Interests
The next section under Audience called Interest gives you access to an amazing array of details about your visitors.
Thanks to cookies that are collected on the computers and mobile devices that your visitors use, Google has a lot of details about their interests. This information about your visitors is available in your Google Analytics account under the Interests section.
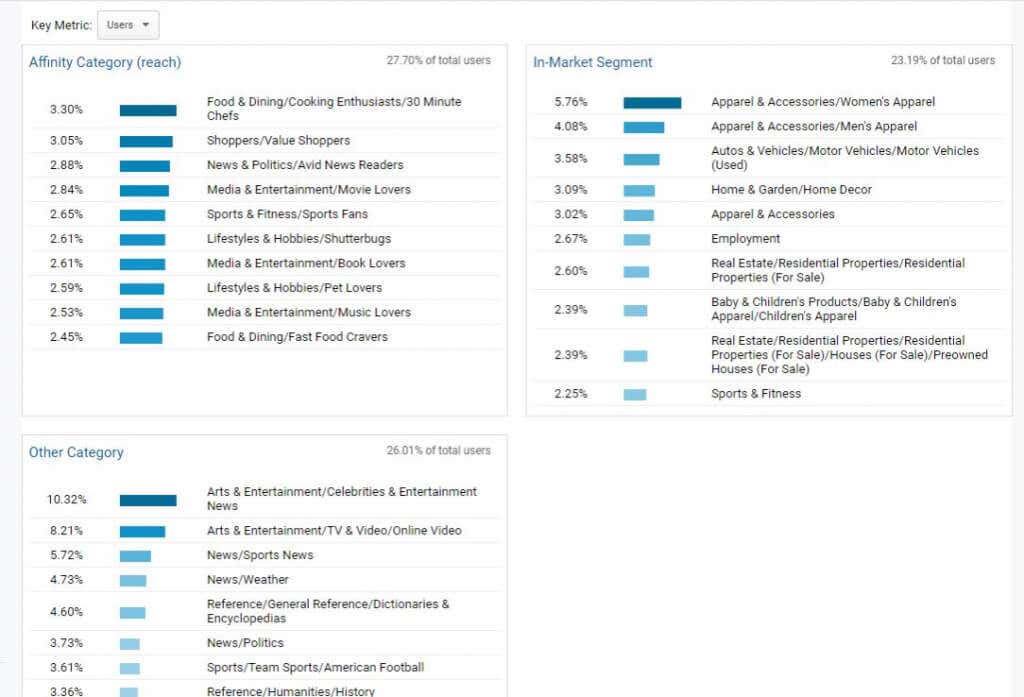
If you select Overview, you can see all of your visitors’ interests organized by interest type. These types are organized as follows:
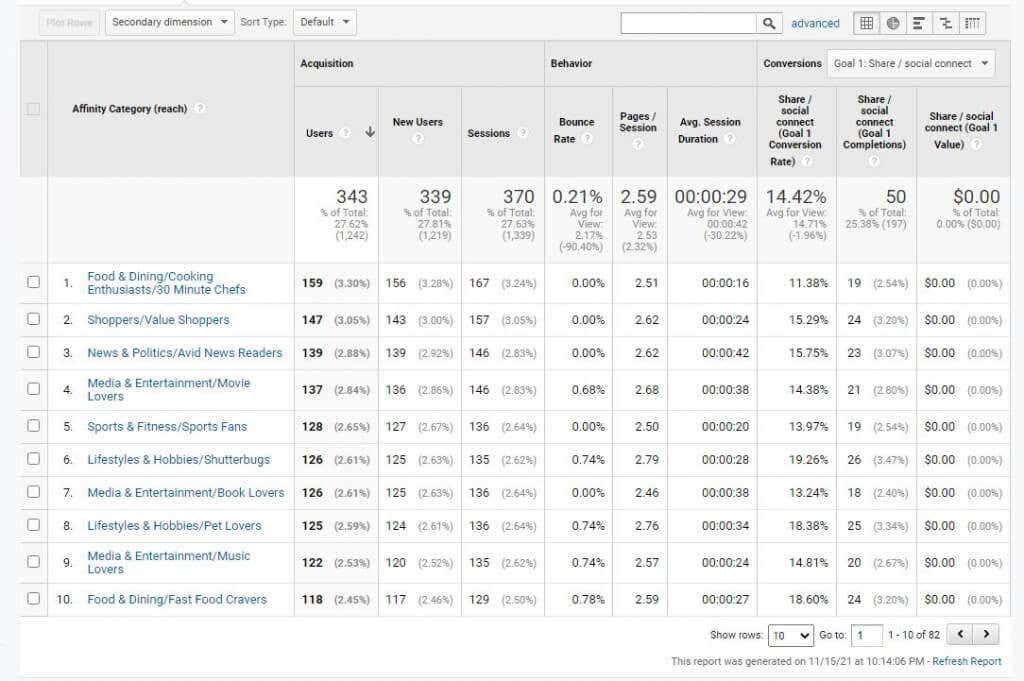
- Affinity Category (reach): Topics that users are more likely to be interested in learning about.
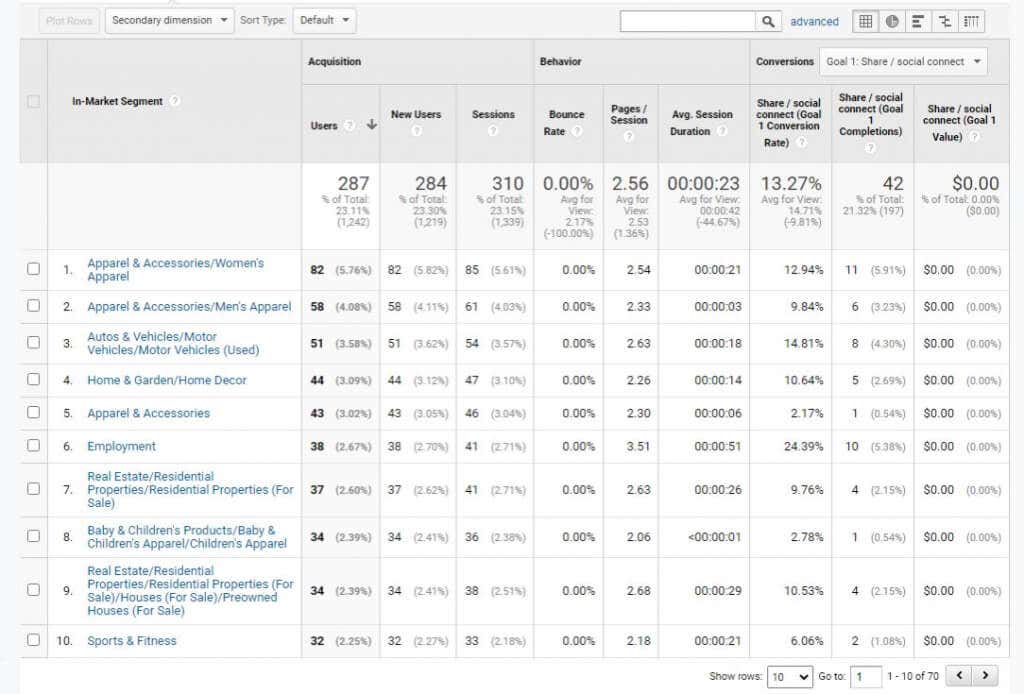
- In-Market Segment: Products and services that your visitors commonly research or purchase.
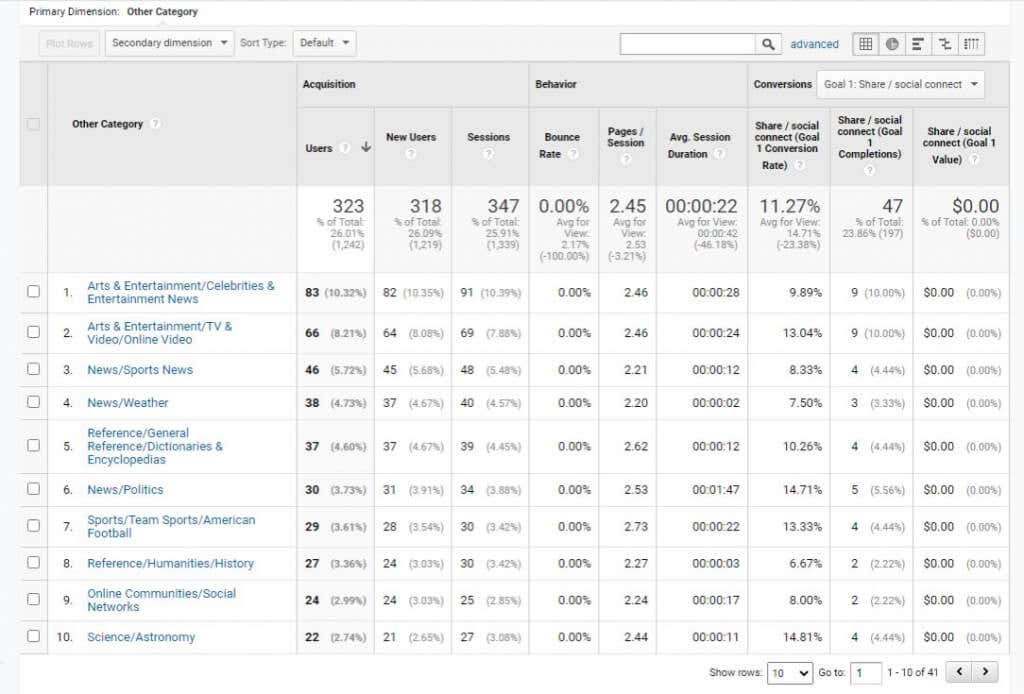
- Other Category: Somewhat more general views of what your visitors are interested in.
You can dive further into these interest categories by selecting these under Interests in Google Analytics. Select Affinity Categories to see how many users have visited your site who have these specific interests.
Select In-Market Segments to see how many users have visited your site who have researched or purchased specific products or types of products.
Select Other Categories to see how many users have visited your site who have a broader, more general set of interests.
How to Use Interests: Knowing your visitors’ interests is one of the most powerful ways to focus the content of your website toward topics that your readers will be most interested in. Affinity Categories are the best place to start if you run a blog or produce articles, but In-Market Segments might be better if you sell products with your website.
Your Visitors’ Geography
If you think it doesn’t matter where your visitors come from, think again. The internet is global, and if you can appeal to an audience beyond just the United States, you stand to attract a much larger audience.
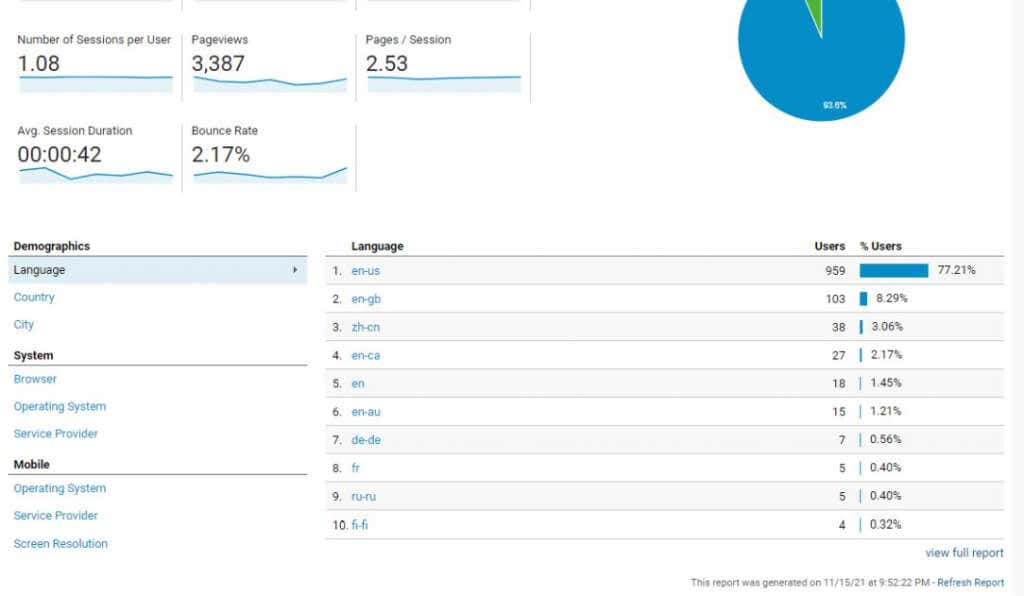
There are several ways to analyze the impact of culture on your audience breakdown. To see where your site stands today, select Geo under Audience. Select Language under this menu.
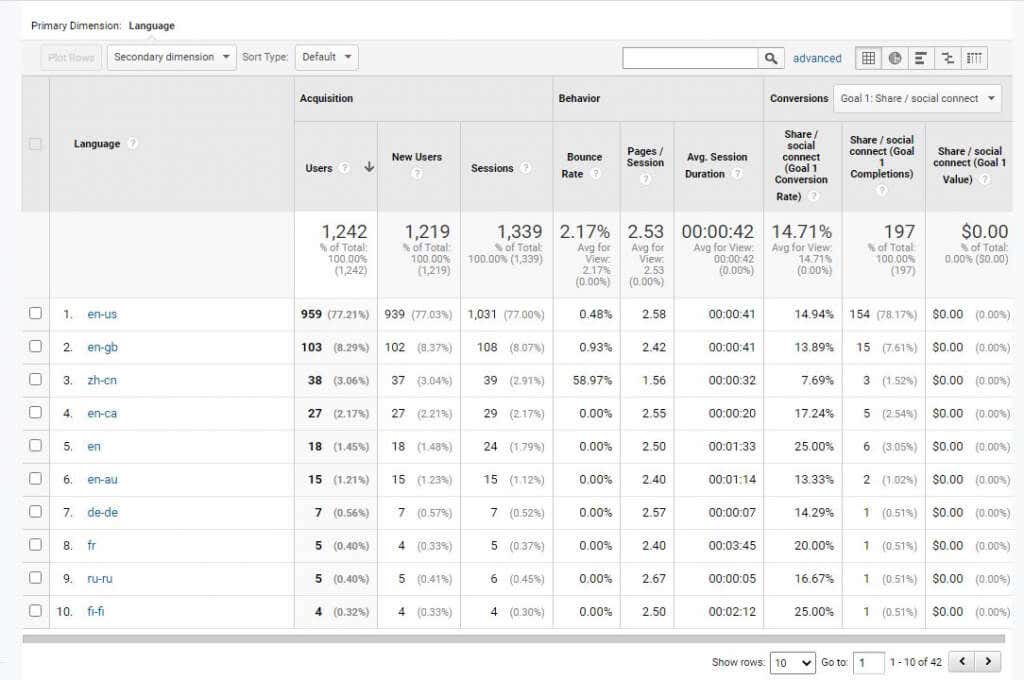
This will show you the primary languages spoken by your visitors. This is largely based on their country of origin, among other factors collected by Google.
However, to see the actual countries your visitors are from, select Location.

At the top of the Location page, you’ll see a global heat map that shows you the volume of your visitors. Darker blue represents more visitors, lighter blue means fewer visitors, and no color means you don’t get any visitors from those countries.
Scroll down the page to see the actual list of countries along with the number of visits from those visitors over the time period you’ve selected.
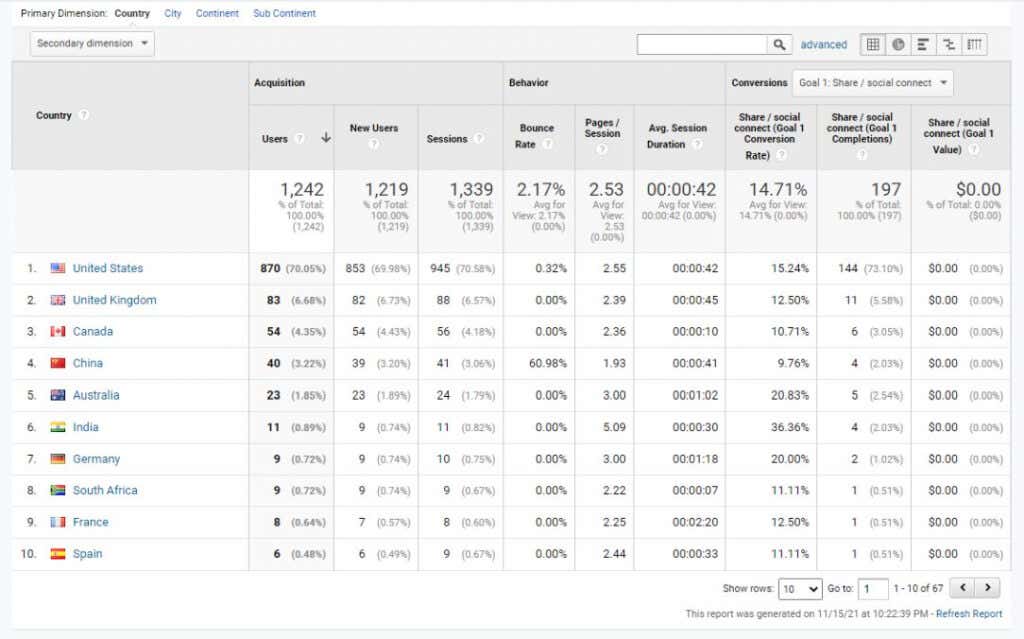
How to use Location: It’s common to have English-speaking Americans as a primary audience. However, you can grow an audience from other countries by including mention of topics that people in other countries care about. For example, you may mention how access to certain services or products may be limited. Or provide visitors with tips on things like how to use a VPN to deal with geographic limitations online.
Your Visitors’ Technology
If you want your visitors to have the best possible experience on your site, you need to tailor the site design to the technology most of your visitors use.
Google Analytics gives you great insights into that technology. Under the Audience menu, select Technology to see this. You’ll see two options under this menu. Select Browser & OS to see the web browser and operating systems most of your visitors use.
Under this section, you’ll notice the Browser tab is selected first, and the number of visits you’ve received from visitors using certain browsers.
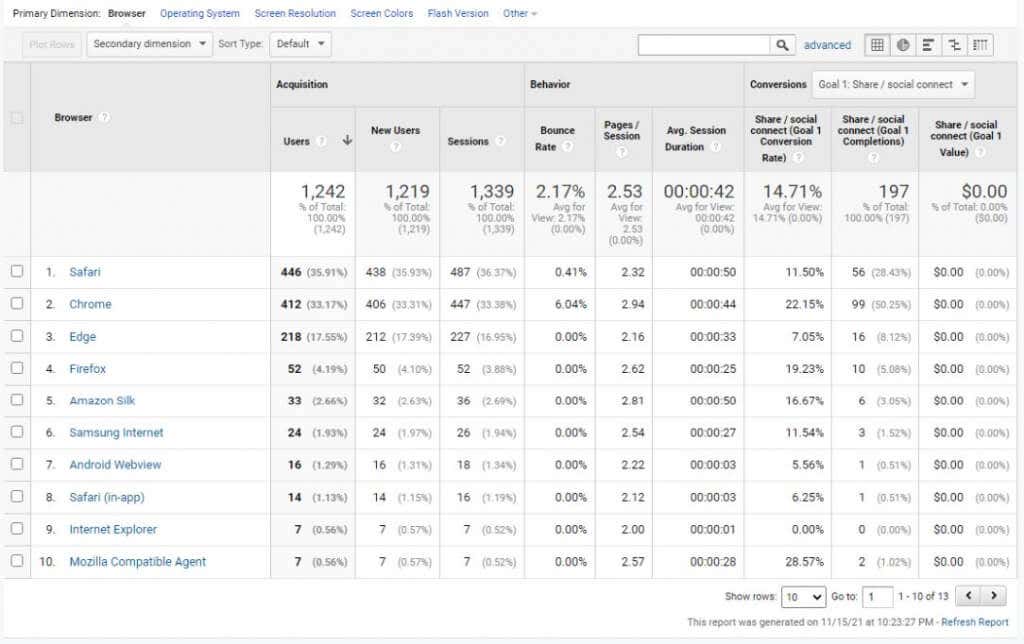
Select the Operating System tab to see the list of most common operating systems your visitors are using.
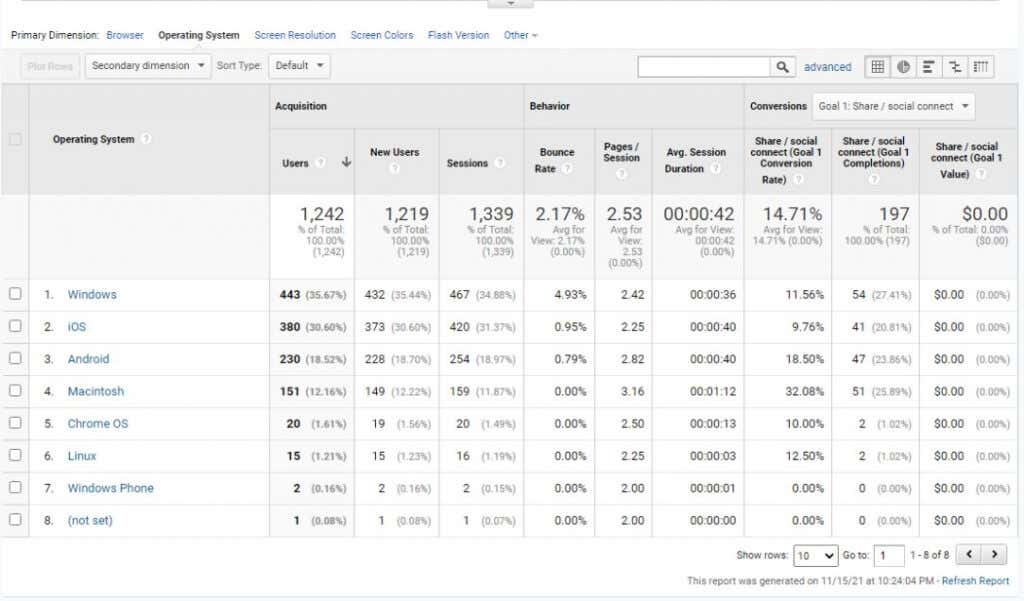
You’ll notice that there are also other tabs at the top that let you explore other things about your visitors’ technology.
- Screen resolution
- Screen colors (bit type)
- Flash version
- Java support (under Other)
If you select the Mobile menu in Google Analytics, you can also see the most common mobile devices your visitors use when they visit with their phone or tablet.
How to use Technology: Knowing the browser, OS, or mobile device most of your visitors use is a powerful way to make sure your site works well for the majority of those visitors. You can use this information to do site testing with the most common technologies your visitors use.
Other Useful User Research Metrics
There are a few other sections under Audience in Google Analytics for other metrics that can give you further insight into your audience.
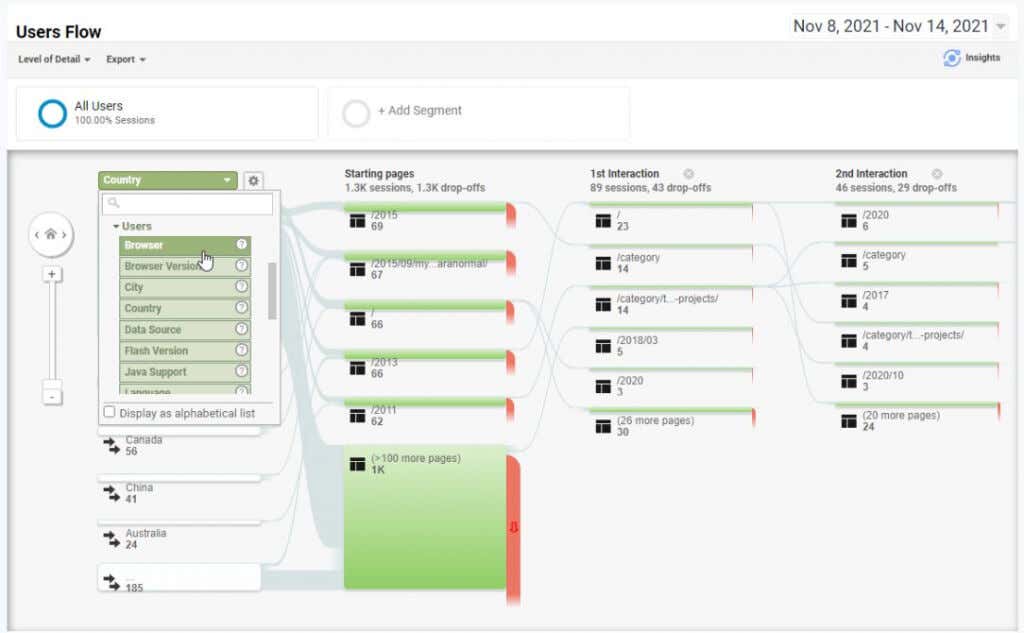
If you select Users Flow, you’ll see an impressive visual that shows you how different user groups navigate your website. Select Country from the dropdown, and you’ll see how users from the United States, United Kingdom, and other countries click through the pages on your site.
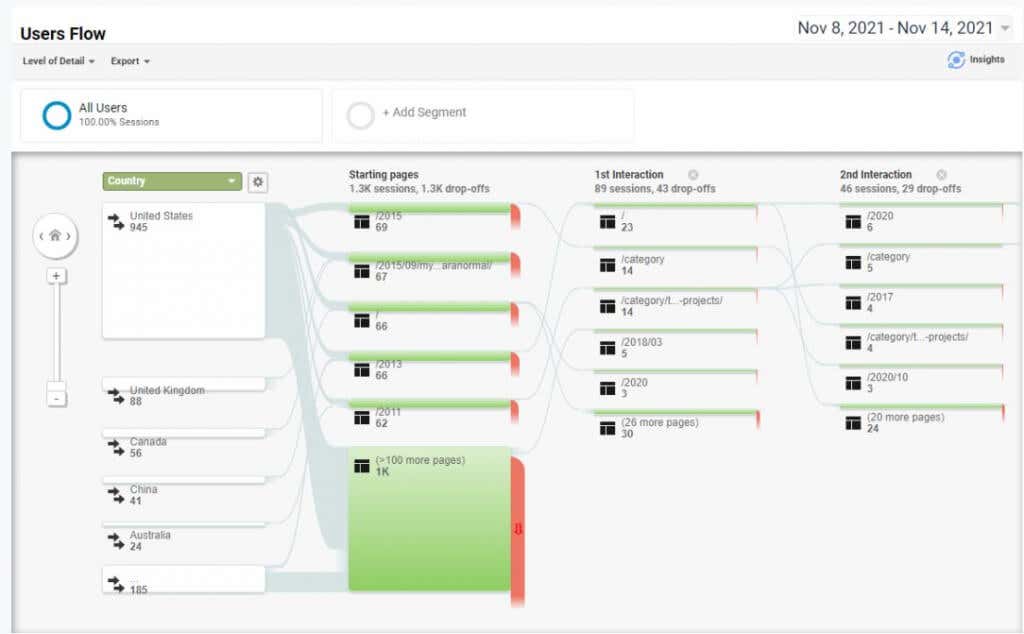
You can also see this visual by selecting other demographic options like browser, language, and more.
Select Overview from the Audience menu and then select Add Segment at the top to include any additional demographics that you want to do comparisons on.
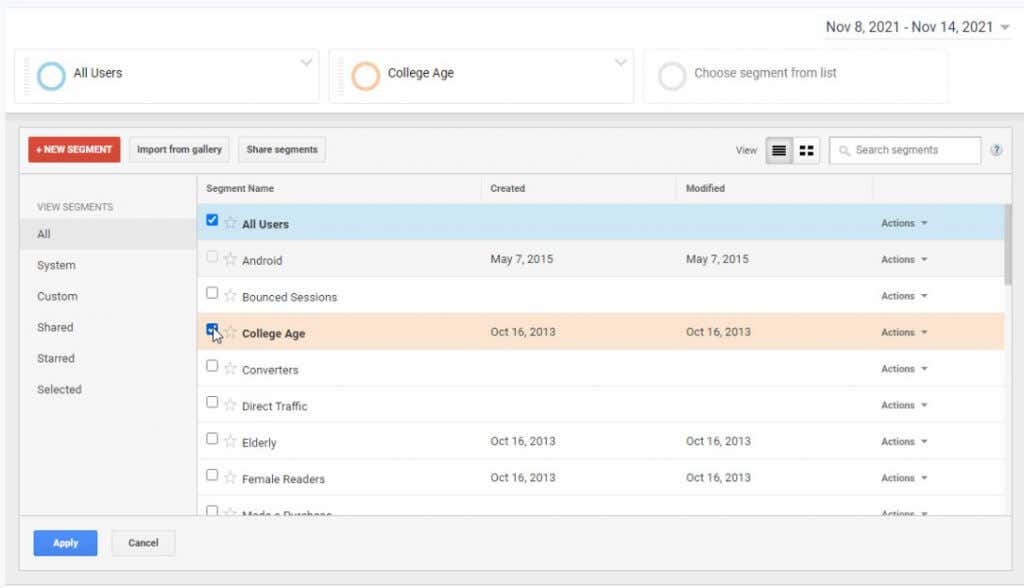
For example, you may want to see the proportion of college-age visitors compared to overall visitors. If you enable College Age as a new segment, the visual at the top of the page will show a second line so you can see this comparison.
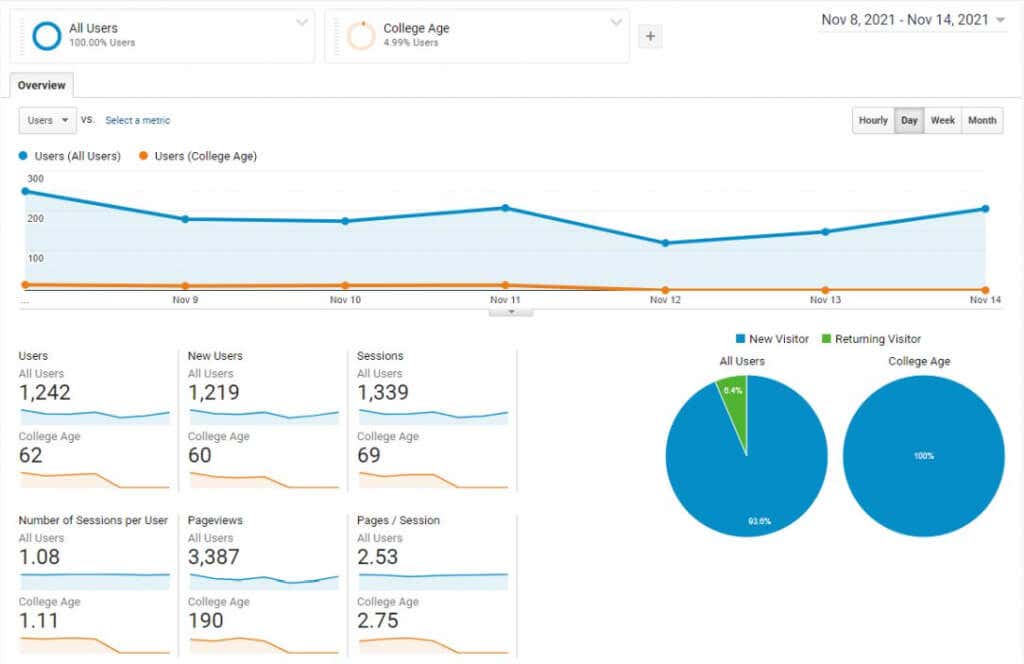
You can add additional segments to this view to compare additional demographic populations in your audience as well.
Doing Google Analytics User Research
As you can see, Google Analytics is a very powerful tool to do user research about your website visitors. This kind of insight can help you tailor your content and even your website design so that it appeals to a much larger audience. It can also help you to ensure that your site looks and feels perfect to the majority of visitors that frequent your website most often.
from Online Tech Tips https://ift.tt/3nugAcM
Σχόλια
Δημοσίευση σχολίου